Superior analytics tracking
Why we emphasis analytics
Helix Media's Stats
online analytics portals

detailed view
In-Depth User Engagement
Our detailed view portal provides insight into user engagement such as: total number of sessions, number of 360 scenes viewed, average session duration, and bounce rate.
Heat Map & Performance by City
See what cities your users are viewing your Helix Tours from and compare performance by city.
Device Breakdown
We live in a mobile-driven world, and it is vital to make sure your Helix Tour is performing optimally on all device types; desktop, tablet, mobile and VR.
Target Market Demographics
Knowing which demographics uer your Helix Tour can help with overall marketing strategy.
Source Data
Helix Tours are very dynamic in how they can be used online. Our detailed analytics portal can compare engagement across various online marketing avenues such as your community's website, social media, email marketing and leasing tablets.
Manager view
Bird's-Eye View
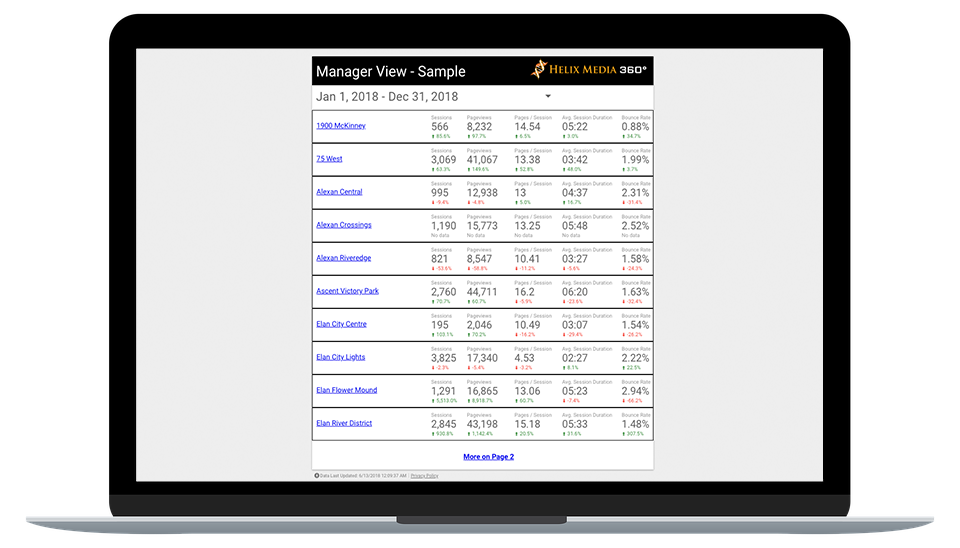
Our Manager View portals are great for marketing managers and regional managers to easily and quickly track engagement across all Helix Tours.
Performance by Helix Tour
See user engagement of all Helix Tours within one report such as: total sessions, number of 360 scenes, average session duration, and bounce rate.
Quickly Spot Issues or Trends
Our Manager View portals are not only great for seeing which Helix Tours are performing best, but also potential issues, which can happen if a website is not displaying a tour properly.
Link to Detailed View
Each project's title links to the corresponding Helix Tour's detailed view if you need to see more information.

cONTACT US
